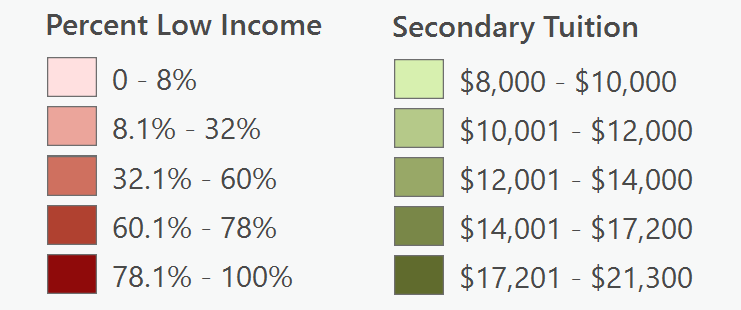
Select whether you want to view the map of the percentage of low-income pupils in each school district or the map of the amount of money spent per secondary education pupil in each school district (indicated by the circle with the dark center). Then click on any school district on the map to view some details about it. The thicker black outlines surround the state's 29 Intermediate Units.
The purpose of this map…
| Highest Values → | Lowest Values → | |||||
| School District | Philadelphia City | Pittsburgh | Central Bucks | Midland Borough | Austin Area | Bryn Athyn |
|---|---|---|---|---|---|---|
| Total Enrollment | 134,129 | 22,384 | 18,441 | 273 | 199 | 0 |
| Highest Values → | Lowest Values → | |||||
| School District | Cornell | Aliquippa | Farrell Area | North Allegheny | Peters Township | Unionville-Chadds Ford |
|---|---|---|---|---|---|---|
| Percent Low Income * | 100% | 99.8% | 94.7% | 5.5% | 4.8% | 4.5% |
| Highest Values → | Lowest Values → | |||||
| School District | Wilkinsburg Borough | Lower Merion | New Hope - Solebury | Tyrone Area | Waynesboro Area | Juniata County |
|---|---|---|---|---|---|---|
| Tuition per Pupil | $22,557.85 | $20,744.13 | $19,807.06 | $8,026.12 | $7,996.73 | $7,799.67 |
PA data source: PA Spatial Data Access (PASDA)
Webpage created by: Jason Rotter, Fall 2017
Modifications by: Dr. Geiger, 2021