
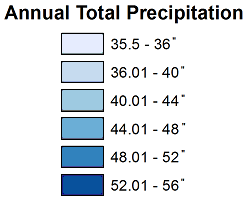
This map is known as an isoline (or isarithmic) map, more specifically, as an isohyet map. Click on any location and its total annual precipitation, averaged over a 30-year period will be displayed. Zoom in to see more precise locations.
| Precipitation | Minimum | Maximum |
|---|---|---|
|
Total Annual Precip.: Location, Amount |
Wellsboro, Tioga County 33.43 in. |
Chalk Hill, Fayette County 54.04 in. |
|
Single-Month Average: Location, Month & Amount |
Wellsboro, Tioga County February: 1.72 in. |
Clermont, McKean County June: 5.91 in. |
Data sources:
NOAA website
Esri, Inc.
PA Spatial Data Access
Map and webpage created by: Dr. Geiger, Spring 2016.